Auckland and north remain in Level 4 lockdown for the time being, but for those of you living south of the Bombays in New Zealand - welcome to Level 3 lockdown, or as it is affectionately called: Lockdown with Takeaways.
Lockdown with Takeaways
For those of you who don't have the great fortune of living in New Zealand, Level 4 lockdown requires all non-essential businesses to shut. This basically means we can go to the supermarket and pharmacy, but nowhere else. I'm still unclear on how a store gets classified as 'supermarket', as butchers and bakeries cannot open, but veggie stores and convenience stores can open. Level 3 enables any store or restaurant to open for contactless service. This means we can get 'takeaways' as we call them here in NZ, or 'fast food' as you may call them. You can also act as your own delivery driver, as click and collect is available if it can be done contactless.
Flatten the Curve
In her daily briefing yesterday, the Prime Minister showed off another visual aid (last week it was a map of close contacts of known cases): a graph of where the New Zealand case numbers could be had we not gone into Level 4 lockdown.
I have been tracking the NZ COVID 19 cases on a logarithmic scale since the beginning, but yesterday's briefing inspired me to highlight it more prominently.
Page Navigation Buttons
I realized that depending on your browser, screen resolution, device, etc, accessing the built in page navigation of Power BI might be tricky. So, I have decided to build it into my report pages.
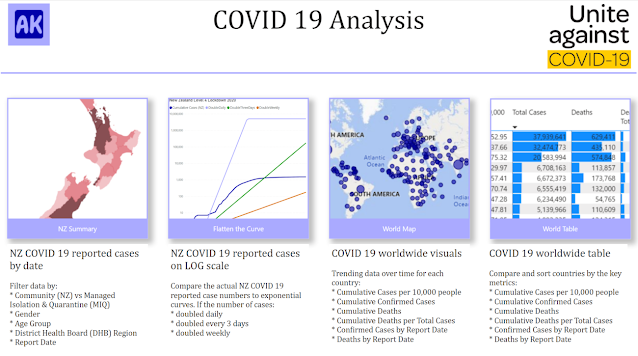
The image above shows an example of what you can create using Power BI buttons.
How to create a Power BI Table of Contents
Creating Buttons in Power BI is easy, it just takes time and care to ensure you have set all the correct actions, tooltips and formats for each button.
In the page above, I have actually created 8 buttons - two for each page. I did this because I wanted the flexibility of being able to change the image without needing to use another application to merge it with the label, and I wanted the user to be able to click either the image or the button in order to navigate.
Step 1: Insert Button
On the Insert tab in Power BI, you'll see Buttons, Shapes, Image. Any of these can actually be used as a 'Button', so pick whichever you prefer. In the above I used Buttons > Blank.
Step 2: Format Button
If you chose an image as your Button, you have already done half the work. Now just format the size, border, etc.
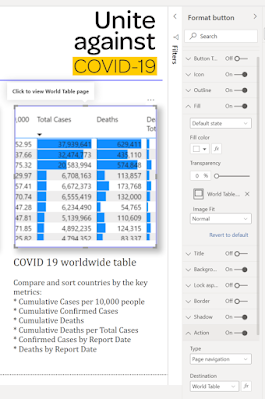
If like me you chose a Blank Button, we need to fill it with an image. Expand the 'Fill' property of your button and click the + to add an image.
Set the transparency - I set mine to 0% because I am creating the text labels as separate buttons.
Step 3: Button Action
Finally, turn the Action to 'On'. Note, this can be done for a button, shape or image, so it doesn't matter what you picked in Step 1.
Choose 'Page navigation' for the Type and select the page you want to navigate to. Note: This can be conditionally formatted which means your button behavior can change depending on the user selections. How cool is that?!
Finally, type something useful in the 'Tooltip' box. This does take extra time, but I think it makes your report MUCH easier to use, so is worth spending the time now as it will save you answering lots of questions from users later.
If you don't want to add a tooltip, leave it blank for the default 'Click here to follow link' message, or as of this month you can even turn the tooltip off!
Step 4: Repeat
Now that you have one button, repeat the process for all other buttons (you can save some time with copy/paste, but you'll need to set all the actions). This is where the care and testing comes in - it's very easy to miss a tooltip or action if you're not careful.
Don't forget to add back buttons on all the other pages so that the user can return to the table of contents.
Try it Out
Have a go navigating through the report below to see how the buttons work. There are lots of other ways you can use buttons for navigation - add them as tabs to the top or side of your page, use a slicer to let the user select the desired page and click 'Go', or tell a story enabling the user to navigate through the report in a specific sequence.


