The MVP Challenge inspired me to expand my knowledge base and start branching out into new areas of technology, but I still like to relate all new learnings back to areas I'm familiar with.
This post is inspired by the MS Learn Natural Language Processing modules in Azure, but I'm putting the Power BI spin on it.
The MS Learn modules are great and give you hands on experience using Azure, but the sample data is curated for the practices and we only had a handful of text reviews to analyze.
How does Text Analytics perform on real data?
I decided to analyze reviews of a product we may all be familiar with: The Definitive Guide to DAX by Marco Russo and Alberto Ferrari.

While most of the reviews are 5 star, it does have reviews for 1, 3 and 4 stars. It also contains reviews in a variety of different languages, so we can see how Text Analytics performs with English, French, Portuguese, Spanish and German.
Sentiment Analysis
How did Text Analytics perform with sentiment analysis? This can be a very subjective measure, but we have a star rating for each review to help us determine the sentiment of the author at the time of writing. My analysis contained two 1-star reviews and sentiment analysis marked one of them as 'positive' and one of them as 'negative'.
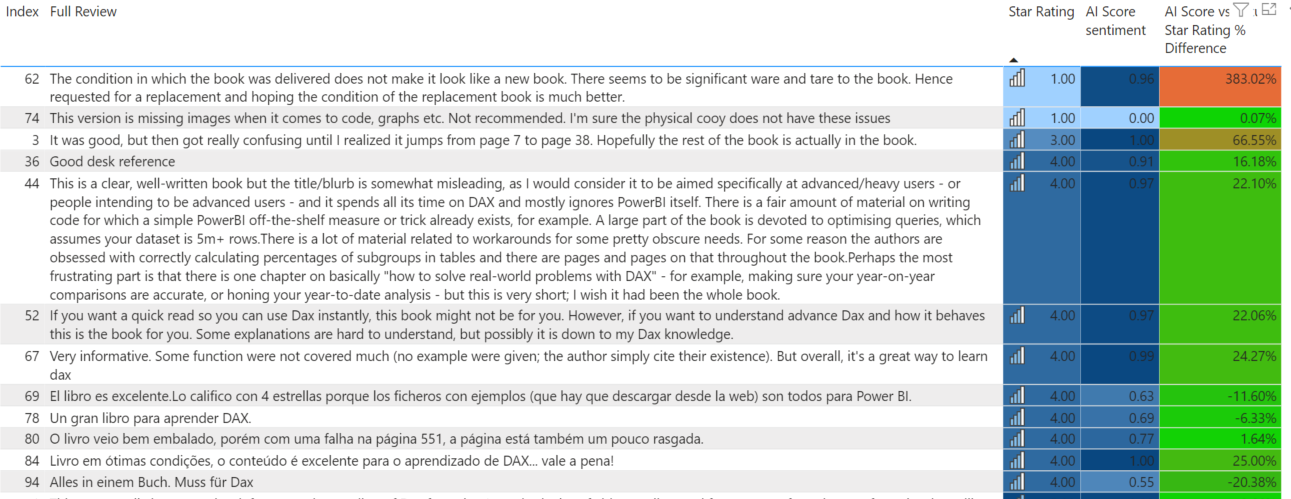
Review #62
The condition in which the book was delivered does not make it look like a new book. There seems to be significant ware and tare to the book. Hence requested for a replacement and hoping the condition of the replacement book is much better.
Star Rating: 1 out of 5 (negative)
Sentiment Score: 0.96 (positive)
AI Accuracy: Incorrect Sentiment predicted
This review was given a sentiment score of 0.96, which indicates that it is very positive. I think you would agree with me that it is NOT positive, but I have highlighted some words which I think the AI model might be viewing as positive. There is a lot of negation in this review which does not seem to be picked up by the AI model.
Review #74
This version is missing images when it comes to code, graphs etc. Not recommended. I'm sure the physical cooy does not have these issues
Star Rating: 1 out of 5 (negative)
Sentiment Score: 0.00 (negative)
AI Accuracy: Correct Sentiment predicted
This review was given a sentiment score of 0.00, which indicates that it is definitely negative. There is also some negation here with 'not recommended' but the AI model seems to detect this more accurately when the phrase is not split as it was in Review #62. However, I need more data to continue to train the model and improve the accuracy of the results.
Language Detection
The Language Detection was 100% accurate on this dataset, and very easy to implement. This helped make the Sentiment Analysis possible, as I could use the detected language as a parameter in the Sentiment Analysis function.
Key Phrases
Power BI Text Analytics detected 389 key phrases from the 100 reviews analyzed. There was a total of 482 uses, so many of these key phrases appeared more than once. It was interesting to me to see how multi-word key phrases were detected even if they only appeared in the dataset once.

This includes phrases such as; clear explanations, consulting time, data models. Phrases that are well-known and often used in other texts. It also included many phrases combined with the key word 'DAX', such as DAX engine, DAX journey, DAX knowledge. Since 'DAX' is itself a key phrase, detection of these multi-part phrases reduces the number of occurrences of the 'DAX' key phrase.
How to: Build the Power BI report
If you'd like to have a go with Text Analytics in Power BI, find any product of your choosing on Amazon.com.
Step 0: Prepare for Exercise
To complete this exercise you'll need a Power BI Premium license - PPU will work just fine. Make sure you're signed in to Power BI with that account.
Browse Amazon.com for a product of your choice and find the Reviews page for that product.
Step 1: Reviews Base Query
Open a blank Power BI report and Get Data > Blank Query.
Generate a single column table for page numbers. If you aren't strong with M code, copy the query below into the Advanced Editor:
letPages = List.Generate(() => 1,each _<11, each _ +1),#"Converted to Table" = Table.FromList(Pages, Splitter.SplitByNothing(), null, null, ExtraValues.Error),#"Renamed Columns" = Table.RenameColumns(#"Converted to Table",{{"Column1", "Page Number"}}),#"Changed Type" = Table.TransformColumnTypes(#"Renamed Columns",{{"Page Number", type text}})in#"Changed Type"
Name this Query 'Reviews'
Step 2: Page Parameter
In Power Query, click Home > Manage Parameters > New Parameter.
Create a Parameter called 'Page' of type text. Set the current value to 1.
Step 3: Amazon.com URL
In Power Query, click Home > New Source > Web

Select 'Advanced'
URL parts:
Select ABC for the first part and paste the base URL for your chosen product. It should look similar to this: https://www.amazon.com/Definitive-Guide-DAX-intelligence-Microsoft/product-reviews/1509306978/ref=cm_cr_dp_d_show_all_btm?ie=UTF8&reviewerType=all_reviews&pageNumber=
Select Parameter for the second part and choose the Page parameter we created in Step 2.
Select the table that looks like it has the 10 reviews per page.
Step 4: SamplePageReviews Query
Once you've selected the reviews table and loaded the query, choose only the columns you need and rename them:
- Reviewed By
- Star Rating
- Review Title
- Full Review
Extract Text Before Delimiter on Star Rating to get just the numeric value.
Step 5: Invoke Custom Function
Right click on the SamplePageReviews Query and 'Create Function'. Call it 'GetReviewsPerPage'.
Disable Load on SamplePageReviews.
Select the 'Reviews' Query.
Click Add Column > Invoke Custom Function
Name the column 'Review Table', use the 'GetReviewsPerPage' function and select the 'Page Number' column as the Page parameter value.
Click OK.
Expand the Review Table column to see all columns.
Click Add Column > Index > From 1
Step 6: AI Insights
From Power Query, click Home > Text Analytics.
If prompted, sign in with your Power BI Premium licensed account.
Wait patiently.

Select the option you want to use (start with language detection so you can use those results for the other two).
Note: The Key Phrases option will expand the data into many rows, so I suggest you reference the Reviews query (right click > Reference) and do the Key Phrases in its own table so as not to duplicate all the reviews in the source table.
Summary
Power BI Text Analytics is extremely easy to use and can provide valuable insights to your data with very little effort. We just need to make sure we take the time to understand a bit more about the AI models we are using and their features and limitations.


