Search

Search this blog:

Search This Blog

DAX vs M


Power BI has two main languages that we use to build reports - DAX and M. While it is possible to author a perfectly functional report without knowing anything about either of these languages, at some stage you are likely to find yourself face to face with some DAX measures or searching the web for a custom code in M. But what is the difference between these two foreign languages and why do you need both of them? Can't we just learn one really well and do everything in DAX or everything in M? 

Not quite. 

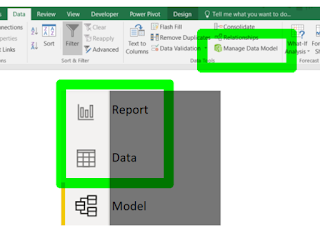
The Power BI Desktop makes the distinction between DAX and M clear by opening the Power Query Editor in a new window. M is the language of Power Query. DAX is the language of Power BI Data Model, or in other words is used in the normal Power BI report and data views. 

For those of you using Excel, M is used in Power Query. DAX is used in Power Pivot Data Model.

Although it is possible to perform similar tasks using either M or DAX, there are some best practice considerations to help you decide when to use each. There is also a precedence. 

  1. M is for building the data model - use this for transformations to your data, new columns, tables, merge and append of data, setting data types.
  2. DAX is for analyzing the data model - use this for explicit measures, dynamic calculations, aggregating and summarizing the data. 
Note that M comes before DAX. Anything you do using M will be available in the data model and can be used in DAX expressions. However, anything you do using DAX is NOT available in the Query Editor and therefore cannot be used in M code. Only columns and tables that are built in the Query Editor can be used and seen inside the Query Editor. DAX is a layer on top that is not accessible by the Query Editor. 

M - Power Query Transformations

To use M code, we need to be inside Power Query Editor. 
From Power BI, select Transform data button in the Home tab in the ribbon.
From Excel, 
  • to edit an existing query, select Show Queries button in the Data tab in the ribbon, then right click on a Query and choose Edit 
  • to create a new query, select New Query button in the Data tab in the ribbon.


Once Power Query Editor opens, the ribbon, options and functionality are almost identical whether you're working in Power BI or Excel. 

In order to use M code in Power Query, you can usually just click the buttons in the ribbon, and Microsoft Power Query will write the code for you. Use the Applied Steps to delete or edit steps that you have made. 

If you want to do something a bit more advanced than what is available in the buttons, or if you want to make a quick edit that can't be done using Applied Steps, you may find writing custom M code to be your best solution. 

To view the M code for each step as you apply them, turn on the formula bar. To turn the formula bar on, tick the Formula bar box in the View tab in the ribbon. 


To view the M code that has been generated by all the buttons you've been clicking, click the Advanced Editor button in the ribbon. 

This will open a window of the entire code that Power Query needs to Get, Transform and Load your data. You can carefully make changes directly to this code, or you can even copy and paste the code from one query to another. 

Here is a sample Power Query code: 

let

    Source = Table.FromRows(Json.Document(Binary.Decompress(Binary.FromText("i45WUjBU0lEKcDJUAFJGJrpepXm6RgZGBiCupalSrA5QhRGQ7RoBUWGAosLcAKICYoYRSMgYVYUFkAQrMYYYgmoGTEEsAA==", BinaryEncoding.Base64), Compression.Deflate)), let _t = ((type nullable text) meta [Serialized.Text = true]) in type table [#" EmpID" = _t, #"CourseID " = _t, #"Date " = _t, #"Result " = _t]),

    #"Changed Type" = Table.TransformColumnTypes(Source,{{" EmpID", Int64.Type}, {"CourseID ", type text}, {"Date ", type date}, {"Result ", Int64.Type}})

in

    #"Changed Type"

Once you're happy with the data and have all the columns, transformations and cleansing of the data, you can load it into the data model. 

In Power BI, just click Close & Apply.

In Excel, click Close & Load to. Make sure you tick the box to Add this data to the Data Model.


DAX - Data Analysis Expressions

To use DAX, we need to be inside the data model. 

In Power BI, this just means being in Power BI Desktop in either the report or data views. 

In Excel, this means being in Power Pivot. To open Power Pivot, click the bright green Manage Data Model button in the Data tab in the ribbon (note this is an Excel COM add-in so you may need to enable it the first time you open).


Although it is possible to create new tables and columns in DAX, I try to avoid this. It will slow down the filtering and slicers in your report, and force users to become unnecessarily frustrated as they wait for a visual to load each time they make a new filter or slicer selection. 


Try to reserve DAX for those analytics calculations, such as measures, that summarize and aggregate your data. Sometimes we must create a new column using DAX if you need to refer to the value of a measure or other DAX calculation. DAX is an analytical layer applied on top of the data model, and therefore cannot be accessed in Power Query. If you need to refer to a DAX calculated measure when adding a new column or table to your data model, you will have to use DAX to do so. Otherwise, create your calculated columns and tables in Power Query using M.

NEW COURSE - Excel Power Tools: Reporting Made Easy


 I've just finished my first ever video course. You can find it on the Radacad Academy: 

Excel Power Tools: Reporting Made Easy

This course will introduce you to the Excel Power Tools – built-in functionality within Excel that’s designed to make your life easier when preparing reports in Excel. If you need to do any reporting, graphing or repetitive tasks in Excel then this is the course for you.  

We will start with a basic overview of Excel tables and cover off some best practice tips for working with data in Excel. Then we will move into an introduction to Excel Power Query – the one-stop-shop for transforming your data within Excel. See how you can quickly cleanse your data with just the click of a button (split columns, replace values, calculated columns, and more).  

From the Power Query, we will load our data into the Excel Data Model. If you struggle with VLOOKUPs or have slow, cumbersome Excel reports due to lots of formulae and calculations, then you don’t want to miss this module.  

Along the way, we will be creating PivotTables and PivotCharts to gather insights from our data. At the end of this course, you will have the tools and knowledge to create robust, insightful, and easy to use Excel reports in a fraction of the time it takes you now. 


I recognize that online learning is quite different to learning in the classroom. For some people, it provides just the independence they need to be able to learn at their own pace. I have tried to keep the most important aspects of in person learning in this video course, providing opportunity for you to pause and reflect throughout the course and relate the examples back to your own scenarios. Please let me know what you think, and happy learning!

It's Complicated: Relationships in Power BI Part 3 (Cross Filter Direction)


Welcome to Part 3 of the It's Complicated: Relationships in Power BI series. If you haven't already read the previous posts, you may review them here: 

It's Complicated: Relationships in Power BI Part 1 (Fact vs Dimension)

It's Complicated: Relationships in Power BI Part 2 (Cardinality)

In this final post in the series, we will look at Cross-Filter direction. If you are an Excel user, this post will help you understand the limitations you have in the Excel data model using single Cross-Filter direction. If you are a Power BI user, this post will help you understand why both Cross-Filter direction can create ambiguity in your data model.

Salmon swimming upstream

To review, we are still working with the standard star schema relationship data model. We have discussed the concept of Fact and Dimension tables, one to many cardinality, and now we need to look at the meaning behind that arrow in the middle of the relationships between our tables. 

In the image below, we can see the same Employee Training Attendance report we've been working with throughout this series. The Dimension tables have a 1 next to them, indicating they are correctly identified as a cardinality of 1 in the key relationship column. The Fact table has a * next to it, indicating it has been identified as a cardinality of many in the key relationship columns. But what does the arrow mean?


Cross Filter Direction

The single arrow indicates that these relationships have a cross filter direction of Single. In Power BI we have two choices for Cross-Filter direction: 

  • Single
  • Both

In Excel, we only have the option to apply Single cross filter direction. Good news - single is the default best option for the most common star schema data models.

What does Single Cross Filter direction mean?

Unlike the salmon leaping upstream in the image at the start of this post, your data CANNOT flow against the direction of the relationship. When the cross filter direction is set to single, data can freely flow from the Dimension table into the Fact table, but not in reverse. 

In practice, that means that our Fact table has virtually every column from each Dimension table, but that our Dimension tables do not have any columns from the Fact table. 

Pro tip: It is also important to note that Dimension tables do not have any columns from other Dimension tables either. 

This means we can filter the Fact table by itself, or by any column in any of the Dimension tables. We cannot filter a Dimension table by a Fact table or by another Dimension. 

Rule of thumb: If using more than one table in the same visualization, fields in the 'Values' must belong to the Fact table. 


In the image above, you can see two matrix visualizations; Count DimCourse[CourseID] and Count FactTrainingAttendance[CourseID].

The Count DimCourse[CourseID] on the top is using the CourseID column from the Dimension table in the Values area of the matrix. This is not allowed when trying to combine with the Gender from a DIFFERENT table because the cross-filter direction is set to single. The Gender can flow into the Fact table, but cannot continue into the DimCourse table, so we are unable to splice and dice the DimCourse table by any other table. DimCourse columns cannot go in the values of a matrix.

The FactTrainingAttendance[CourseID] table on the bottom is using the CourseID column from the Fact table in the Values area of the matrix. This works because the Gender from DimEmployee can flow in the direction of the arrow with our single cross-filter direction and splice and dice the Fact table, so we can count the CourseID column in the Fact table and place this in the values of a matrix.

Avoid Both Cross-Filter Direction in One to Many Relationships

While it may seem tempting to change the cross-filter direction to both to get around this limitation, it is NOT recommended for one to many relationships. It can add ambiguity to your data model. Gender can easily flow into the Fact table - we have 1 gender for each EmployeeID, so know exactly what Gender to place in each row of the Fact table. But what happens when we try to pull Gender into the DimCourse table? 

Recall our data tables look like this: 

FactTrainingAttendance

 EmpIDCourseID Date Result 
 1PB1 24-Jun-2020 95
 2EX1 20-Jun-2020 70
 1PB2 30-Jun-2020 80 
 3EX120-Jun-202080 

DimCourse

CourseIDCourse NameCourse CategoryLevel
 PB1Power BI EssentialsPower BIBeginner
 PB2Power BI Next LevelPower BI Intermediate
 EX1Excel EssentialsExcelBeginner

DimEmployee

EmpIDName    Date of BirthGender
 1John24-Jun-1960 M
 2Paul20-Aug-1988 M
 3Mary14-Feb-1975F

So if we try to put Course Name in values, and Gender in Columns, we want to know how many courses were attended by each gender. That sounds simple, we just need to figure out which Gender to put in the DimCourse table for each course. Let's look at Power BI Essentials. In our small data sample, this was attended by EmpID 1 only. EmpID 1 = Male (John). Ok, 1 for Males. Power BI Next Level was also attended by only one employee, the same EmpID = 1. Ok, 2 for Males. Excel Essentials was attended by two employees - EmpIDs 2, 3. EmpID 2 is Male, but EmpID 3 is Female. What gender can we assign to Excel Essentials? It is ambiguous. Therefore, the cross-filter direction should stay set to single for a one to many relationship. 

It's Complicated: Relationships in Power BI Part 2 (Cardinality)


Get Data > Transform and Clean Data > Check Relationships > Visualize Data

This is the general order of operations for building a successful report in Power BI desktop. In this series, I want to discuss relationships in Power BI and why it's important for you to have a basic understanding of the underlying Power BI data model. 

In It's Complicated: Relationships in Power BI Part 1 (Fact vs Dimension) we discussed how to identify Fact and Dimension tables in a typical star schema: 

  • Fact table - usually one per report (though it's possible to have multiple fact tables in one data model) that is the central table of transactions (sales, events, logs, requests, audits, etc). 
  • Dimension tables - as many as needed to store commonalities, demographic or dimension data about the transactions (customers, locations, dates, leave type, department, etc)
Once you have identified the Fact and Dimension tables, you must identify the key identifying columns that relate the two tables. In Power BI we can only select one column from each table to make this connection. In Part 1 of this series, we chose the key identifying columns based on common sense and common information between the tables. 

In this post, we are going to look at the Cardinality of the relationship between two tables, and the role it plays in choosing the key identifying columns. 

Cardinality

Cardinality is defined as 'the number of elements in a set'. In order for this to make sense with our data, we must think of our set as a single value for one of our key identifying columns. With most data models, you have three main choices for cardinality; 
  • 1 to 1
  • 1 to many / many to 1
  • many to many
Note I have crossed off many to many - this cardinality is not available in Excel and is not recommended in Power BI unless you are an expert with understanding relationships and really know you need it.

A typical star schema, has 1 to many cardinality for the relationships between the Fact table and each Dimension table. 

If we look back at our example from the previous post: 

FactTrainingAttendance

 EmpIDCourseID Date Result 
 1PB1 24-Jun-2020 95
 2EX1 20-Jun-2020 70
 1PB2 30-Jun-2020 80 
 3EX120-Jun-202080 

DimCourse

CourseIDCourse NameCourse CategoryLevel
 PB1Power BI EssentialsPower BIBeginner
 PB2Power BI Next LevelPower BI Intermediate
 EX1Excel EssentialsExcelBeginner

We can see that CourseID exists in both tables. In order to be able to use this as a key relationship column, we need to check a few things: 

  • Does the data type match? Yes! Both are text.
  • Are they in the same format? Yes! Both have two letter abbreviation followed by number with no spaces.
  • Is there a one to one or one to many cardinality? Hmm, what does that mean again? 

Remember we defined cardinality as the number of items in a set. I said you need to think of your set as a single unique value for the column. We have three sets to look at here; PB1, PB2 and EX1. In order to see if this relationship follows the cardinality we need, I must count the number of times each item appears in each table. 

DimCourse

CourseIDNumber of Times in FactTrainingAttendanceNumber of Times in DimCourseUnique in Dim table?
 PB111Yes
 PB21Yes
 EX12 (many)1Yes

 Note: You can use the Column Distribution option in Power Query Editor (tick the box in the View tab i the ribbon to turn on Column Distribution) to see the cardinality of each item for the first 1000 rows of your data. 

FactTrainingAttendance: CourseID Cardinality = many

In the image above, you can see that CourseID has more distinct values than unique values. This means that not every CourseID is unique in the Fact table, and that some CourseIDs appear multiple times in the FactTrainingAttendance table. The cardinality for CourseID in the fact table is many.

DimCourse: CourseID Cardinality = 1

In the DimCourse table, we can see that the number of distinct values is equal to the number of unique values. This means that every CourseID in the DimCourse table is unique and only appears one time in the Dimension table. The cardinality for CourseID in the dimension table is 1.

DimCourse to FactTrainingAttendance: Cardinality = 1 to many

Therefore if we use CourseID to relate DimCourse to FactTrainingAttendance, our cardinality will be 1 to many. Let's check that list again: 
  • Does the data type match? Yes! Both are text.
  • Are they in the same format? Yes! Both have two letter abbreviation followed by number with no spaces.
  • Is there a one to one or one to many cardinality? Yes! Cardinality is 1 to many.

BONUS: Choosing the right key

What if we change our data slightly and add a new column to the fact table. Imagine our data now looks like this: 

FactTrainingAttendance

 EmpIDCourse Number Course CategoryDate Result 
 1PB24-Jun-2020 95
 2EX20-Jun-2020 70
 1PB30-Jun-2020 80 
 31EX20-Jun-202080 

DimCourse

Course NumberCourse NameCourse CategoryLevel
 1Power BI EssentialsPBBeginner
 2Power BI Next LevelPB Intermediate
 1Excel EssentialsEXBeginner

Could we use Course Category and Course Category as our key columns for the relationship between these two tables? Let's review our checklist again: 

  • Does the data type match? Yes! Both are text.
  • Are they in the same format? Yes! Both spell out the entire category.
  • Is there a one to one or one to many cardinality? No! Cardinality is many to many.

Power BI category (PB) appears many times in both the Fact and the Dimension table. The key column in the dimension table must ALWAYS have a cardinality of one, meaning that every value in the key column of the dimension table must be unique. 

In this example, if we try to use Course Category as the key column for the dimension table, I would not know which Level to assign to the course on 24 Jun - I know that it's in the Power BI (PB) category, but when I check the DimCourse table for Course Category = PB, I have two choices; Beginner and Intermediate. Therefore, my results would be ambiguous. I have Power BI Essentials and Power BI Next Level to choose from.

If we use the CourseID, I know that the course on 24 Jun is Course Number 1. Again, Course Number 1 appears multiple times in the DimCourse table - again my results would be ambiguous. I have Power BI Essentials and Excel Essentials to choose from.

How do I know which course to choose? 

Power BI and Excel only allow us to use ONE column to create relationships between our tables, so I must create a single column unique CourseID. Looking at the above options:

Course Category as key gives - Power BI Essentials, Power BI Next Level

Course Number as key gives - Power BI Essentials, Excel Essentials

Power BI Essentials is the only course in both lists, so this must be the right choice. However, I can only know this if I look at BOTH Course Category AND Course Number.

So let's merge these into a single column in both tables: CourseID

FactTrainingAttendance

 EmpIDCourse Number Course CategoryDate Result CourseID
 1PB24-Jun-2020 95PB1
 2EX20-Jun-2020 70EX1
 1PB30-Jun-2020 80 PB2
 31EX20-Jun-202080 

EX1

DimCourse

Course NumberCourse NameCourse CategoryLevelCourseID
 1Power BI EssentialsPBBeginnerPB1
 2Power BI Next LevelPB IntermediatePB2
 1Excel EssentialsEXBeginnerEX1

If we use the new CourseID column as key, I know that the course on 24 Jun is CourseID PB1. PB1 is only in the DimCourse table once, so I know that it falls into Beginner Level. 

Conclusion

Make sure you understand your data well enough to verify that the relationships created in Power BI and Excel data models are correct. Fact tables should have cardinality of many. Dimension tables should have cardinality of one. Not all data models are as straightforward as this example, so reach out if you have any questions. 

If you're using Excel, this is all you need to worry about when creating relationships. If you are using Power BI, you have one more choice to make - Cross Filter direction. We will cover cross filter direction in Part 3 of the series. 

It's Complicated: Relationships in Power BI Part 1 (Fact vs Dimension)


Get Data > Transform and Clean Data > Check Relationships > Visualize Data

This is the general order of operations for building a successful report in Power BI desktop. In this series, I want to discuss relationships in Power BI and why it's important for you to have a basic understanding of the underlying Power BI data model. 

UPDATE January 2023: Microsoft Learn have recently updated their explanation of star schema in Power BI with a much more useful explanation that can be found here: 
https://learn.microsoft.com/en-us/power-bi/guidance/star-schema

The most common data model is a star schema, and consists of: 
  • Fact table - usually one per report (though it's possible to have multiple fact tables in one data model) that is the central table of transactions (sales, events, logs, requests, audits, etc). 
  • Dimension tables - as many as needed to store commonalities, demographic or dimension data about the transactions (customers, locations, dates, leave type, department, etc)

Note that Dimension tables have nothing to do with dimensions of objects (as pictured), except that in both cases you must ensure you have as many dimensions as needed to paint a clear picture of your desired result.

In a typical star schema, we create a relationship between the Fact table and each Dimension table based on key identifiers, or columns that both tables have in common. It is not always straightforward which table is the Fact table and which tables you need to use for Dimension tables, so let's start with a few examples. 

Example 1: Employee Training

We will start by using employee training as an example, where you want to track the number and type of training that each employee has attended in the past month. 

Fact Table: Training Attendance

Your Fact table might look something like this: 

FactTrainingAttendance

 EmpIDCourseID Date Result 
 1PB1 24-Jun-2020 95
 2EX1 20-Jun-2020 70
 1PB2 30-Jun-2020 80 
 3EX120-Jun-202080 

Note that we have one row for each transaction; in this case a transaction is every attendee at a training event. This means that each event is listed multiple times in the Fact table, as we had multiple employees in attendance. It also means that each employee can be listed multiple times in the Fact table, as an employee can attend multiple training sessions. 

I can see at a glance that 3 employees have attended three different courses, but I do not have any specific information about those employees or the courses. 

Dimension Tables: DimEmployee, DimCourse

What if I want to know the gender, job title or age group of those employees? What if I want to know the category of the course? In order to capture and report on this information, I will add two new Dimension tables to my model. The reason for using Dimension tables here is that the information in these tables stays static across many transactions: 
  • An employee does not change their birth date or gender each time they attend a course. 
  • A course does not change categories each time it is run (an Excel course is always in the Excel category, a SharePoint course will always be SharePoint category). 
The dimension tables we need to answer the questions about attendance by gender or course category therefore look like this: 

DimEmployee

EmpIDName    Date of BirthGender
 1John24-Jun-1960 M
 2Paul20-Aug-1988 M
 3Mary14-Feb-1975F

DimCourse

CourseIDCourse NameCourse CategoryLevel
 PB1Power BI EssentialsPower BIBeginner
 PB2Power BI Next LevelPower BI Intermediate
 EX1Excel EssentialsExcelBeginner

Related Columns

Once you have identified the Fact and Dimension tables, you must identify the key identifying columns that relate the two tables. In Power BI we can only select one column from each table to make this connection. In this example, how can we relate the FactTrainingAttendance table to the DimEmployee table? How can we relate the FactTrainingAttendance table to the DimCourse table? 

FactTrainingAttendance[EmpID] relates to DimEmployee[EmpID]
FactTrainingAttendance[CourseID] relates to DimCourse[CourseID]


Example 2: Incident Reporting

Let's use incident reporting for our second example describing Fact and Dimension tables, since it differs a bit from the typical sales examples already posted on the internet.

Fact table: Incident Reports

If you are reporting on incidents that have been reported over the past month, you might see a FactIncidentReports table with columns such as:
  • IncidentID
  • IncidentDate
  • EmployeeID
  • ReportID

Dimension tables: DimDate, DimEmployee, DimIncident

From that small amount of information, I can use the Dimensional (demographic/static) data that I already have, to find:
  • Month
  • Employee name, gender, age
  • Incident type, severity
This information can be pulled from the Dimension tables: 

DimDate

  • Date
  • Year
  • Quarter
  • Month
  • Month Number
  • Day of Week

DimEmployee

  • EmployeeID
  • Employee Name
  • Gender
  • Date of Birth

DimIncident

  • IncidentID
  • Incident Name
  • Incident Type
  • Severity

Related Columns

If we focus on the DimEmployee table, I only need to pull in data for each employee ONCE, to save space in my data model. We can use the EmployeeID column to connect the DimEmployee table, and all the data in it, to every incident that employee reports in the FactIncidentReports table, which may be MANY over the course of a month or year. 

FactIncidentReports[IncidentID] relates to DimIncident[IncidentID]
FactIncidentReports[IncidentDate] relates to DimDate[Date]
FactIncidentReports[EmployeeID] relates to DimEmployee[EmployeeID]

Star Schema

Now that we've seen a few examples, you can understand the common identifying features of a Star Schema data model: 
  • a Fact table - one row per transaction, few columns to avoid repeating information
  • a Dimension table - holds static details that relate to a key identifier in the Fact table, saves space in data model by avoiding duplicate information or double data entry
Once you have identified your Fact and Dimension tables, you are now ready for the next step - creating relationships between them. In the next post we will look at how to create these relationships and something called Cardinality. 

Custom Visual Review: Charticulator

This is not your ordinary custom visual - this is EVERY custom visual. Charticulator puts the power to design and develop custom visuals to ...