The Power BI 'tooltip' is available in almost all Power BI visuals. What is a tooltip?
Tooltip: a message which appears when a cursor is positioned over an icon, image, hyperlink, or other element in a graphical user interface

View the Live Power BI report here
Power BI Tooltips
Almost every visual, both built-in and custom, has a tooltip section of the fields that can be added to the visual. By default, any fields that are included in the 'Values' will automatically show up in the tooltip, but you have the ability to add additional fields to the tooltips.
Default Tooltip
With the default tooltip, you have very little control over the order and format of the fields:
- Fields used in the visual as 'Values' will be listed first, in the same order they are listed in the 'Values'
- Fields used in the visual as 'Tooltips' will be listed under the 'Values' fields, in the same order they are listed in the 'Tooltips'
- Fields used in the visual as 'Values' cannot be removed from the tooltip
- Fields used in the visual as 'Values' must have the same format in both the visual and the tooltip
Now I have a few complaints with these settings for my current visual. I am only plotting the Auckland alert level, but would like the tooltip to display the alert levels for all of NZ, in a natural language friendly manner rather than the label and numerical value.

With the tooltips feature I could add the natural language statement (see visual above for 'Lockdown March 2020 Key Event Value: Level 4 Nationwide') but I cannot remove the value used to plot the levels in my graph (see visual above for 'Lockdown March 2020 AKL Level: 4.00')
I would also like to reorder the fields so that the March 2020 stats are grouped (including the friendly natural language tooltip) and the current stats are grouped.
Report Page Tooltip
If we move from the 'Fields' to the 'Format' section of our chosen visual, we find a 'Tooltip' formatting option that can be expanded. This allows us to change the 'Type' to 'Report page'.

Once you select the 'Report page' as the tooltip Type, a new dropdown will appear for 'Page'. All the other options below this Page dropdown apply only to the Default tooltips, so ignore them on Report page tooltips.
How to Create Report Page Tooltip
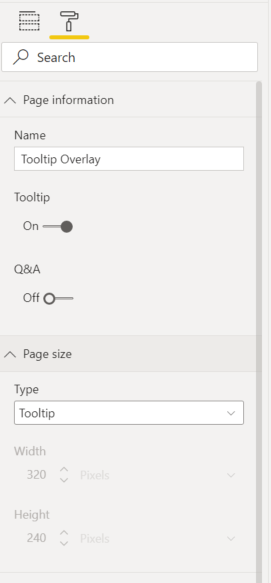
Step 1: Create Tooltip Page Format
Add a new page to your report. Click the Format paint roller to format the page:
- Page information: turn 'Tooltip' to 'On'
- Page size: set 'Type' to 'Tooltip'
Step 2: Add Tooltip page Field
Add the same field used in the axis of your visual to the 'Tooltip' section of the Visualizations pane. This 'Tooltip' section only appears if you have done Step 1.

Select a single value in this filter so you can visualize and test the tooltip design.
Step 3: Design Tooltip page
Add any visuals or information to your page. Keep in mind this is a tooltip, so it will be small and users cannot click or interact with it - so keep it simple! However, you can use conditional formatting, color, maps, charts or any visual tricks and features you want just like a normal Power BI report page.

I've kept mine simple and just grouped the information I want in an easier to read format.
Step 4: Update Visuals Tooltip settings on other pages
By default, any visuals that use the field you added to the 'Tooltip' field will update to use the Report page tooltip instead of the default tooltip. In my example, any visual that uses the Days[Days In Lockdown] field will automatically start using my tooltip page instead of the default tooltip.
If I create another tooltip page using that same field, Power BI won't know which to pick so to be safe, go find the visual where you want the tooltip.
Select the visual and click the Format to format the Report page tooltip options we discussed above:
- Change 'Type' to 'Report page'
- Change 'Report page' to 'Tooltip Page Name' (where 'Tooltip Page Name' is the actual name of your tooltip page you created in Step 1)
Tooltips are Easy and Effective
That's all there is to it! Tooltips are an easy and effective way to make your report more meaningful and accessible to all audiences.


