Today's post is inspired by @Iguima of the Power BI Community. You can read their original Date Categorical Slicer question on the Power BI Community Desktop Forum.
The original poster would like to achieve a categorical date slicer that enables the report user to filter the Sales (fact) table for all data AFTER the selected event/date category. Something similar to the final result below:
Note the events span over 20 years and include the 911 terrorist attacks on the USA, COVID 19 pandemic and also some not so catastrophic events such as iPhone first release date. I have added a few more recent events for 2020-21 in case you want to test on your own sales data (which might not span 20+ years!).
| Event Name | Event Date |
|---|---|
| COVID 19 Outbreak | Wednesday, March 11, 2020 |
| Joe Biden wins US Presidency | Saturday, November 7, 2020 |
| Taliban take over Kabul | Sunday, August 15, 2021 |
| 911 Attacks | Tuesday, September 11, 2001 |
| iPhone Released | Friday, June 29, 2007 |
For reference, I have highlighted the important parts of the original question:
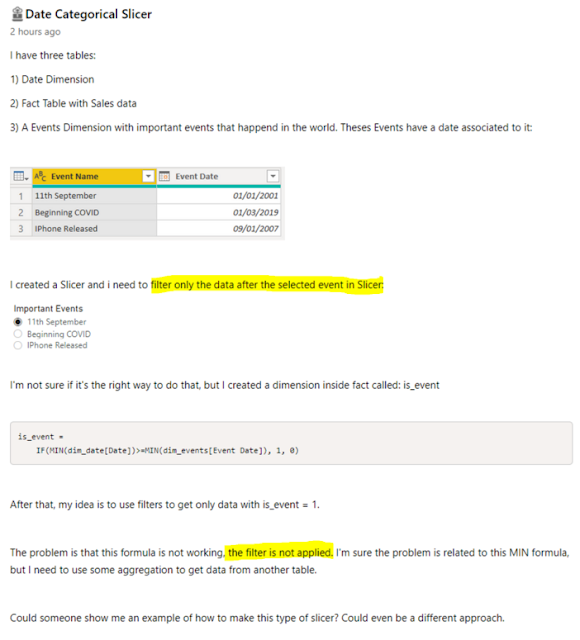
There are two key issues in this request:
- We want to filter for data only AFTER the selected event. Most filter behavior will return data only ON the selected event.
- We want this to be responsive to the filter and slicer selections made by the report consumer.
I have already written about key issue number 2 in a previous blog on Reporting Order of Operations. Basically, calculated columns do not respond to report filters and slicers. We need to solve this problem with a MEASURE.
Data Model
Before we can get into the measure and DAX, we need to review the Data Model. Any of my former students will tell you this is the foundation of your Power BI report. Without the correct data model, DAX won't work.
For this scenario, we want the Important Event to act as a bookend for our Date table, not filter it just for that specific date. Therefore we need to ensure that the Important Events table is NOT related in any way to the other tables in our data model.
Below I have a very simple data model: Calendar (date dimension) and Sales (fact) with my Important Events (Categorical slicer table) unrelated to any of these.

DAX Formula
Now that we have the Data Model sorted, we can move on to the DAX.
We start with a simple measure for Total Sales:
Total Sales =
SUM ( Sales[Sales Amount] )
Use this [Total Sales] measure in a visualization by Calendar[Year].
We then add a slicer for the 'Important Events'[Event Name]. Since the Important Events table has no relationship to our data, this won't do anything in our report.
In order to get the Total Sales to filter based on the slicer, we need to figure out what value the user has selected. I have chosen to use the MIN function in case multiple events are selected. This will ensure we are looking at all data after the earliest event.
Selected Event Date =
MIN ( 'Important Events'[Event Date] )
NOTE: Because the [Selected Event Date] is a measure, it will respond to user selections in the slicer as per the Reporting Order of Operations blog.
Finally, we can use this measure as a filter. You may initially be tempted to write the following DAX and get an error:

I haven't used CALCULATE within the filter, but I have used [Selected Event Date] measure, and every measure has an implicit CALCULATE function in front of it. Therefore this DAX expression is not allowed.
Instead, we need to provide a ROW CONTEXT for the calculation, here I use the FILTER function to provide this context. Now, I am able to use the [Selected Event Date] measure (with its hidden CALCULATE function and all) inside the filter expression:
Sales After Selected Event =CALCULATE (
[Total Sales],
FILTER (
'Calendar',
'Calendar'[Date] > [Selected Event Date]
)
)
Hurray! We get the final result we're looking for, as per the GIF at the start of this article.
CONCLUSION
You cannot use COLUMNS to respond to filter/slicer selections.
You must not have relationships if you want to do before/after/range filters.
Once we have overcome these two obstacles, the desired result is achievable. Now to just update any other measures with this added filter.


