I spend a lot of time using line and column charts, but in trying to overlay different types of information for different time periods, I have discovered that the Area Chart is really effective and underutilized (at least by me).
Today I'm using it to overlay two lockdown time periods and visualize the total number of COVID 19 cases in each period.
Area Chart
Scores
Data Clarity: 8/10
Versatility: 8/10
Fun Factor: 7/10
PBI Certified: Yes (Built-in default visual)
Description
The Basic Area Chart is one of the original built-in visuals. It is useful for showing trends over time. Specifically it highlights the volume trending over time, because it shades the area under the line. If you remember back to high school calculus that area under the line/curve is the volume. Area charts do a great job of focusing the eye on the full volume, making it easier to see the big picture and compare values. I've found it's a good compromise to using cumulative values - just the simple act of shading the area under the line causes the human eye to include all the historical values with the current value and aggregate them.
As you hover over the area chart, you also get a line showing where you are, which again makes it easy to compare the two regions to left and right of your cursor and see the difference in VOLUME for the two areas.
How to
Fields
The Area Chart accepts data into the following field categories:
- Axis
- Legend
- Values
- Secondary values
- Small multiples
- Tooltips
Axis
This should ideally be a date, time, duration or continuous (usually time based) field. In my example I have used 'Days in Lockdown' as my continuous time measure.
Legend
This can be used for categorizing your data. Either use Legend OR put multiple fields in the Values category. If you have something in legend, it will determine the different colors and lines (we call these 'series' in the data viz world). In my example I have opted to use multiple values, so must leave legend empty.
Values
Almost every Power BI visual has a values pane - put your explicit measures here. If your 'Legend' category is empty, you have the option to put multiple values in the Values category. In my example I have two measures in here to show the Alert Level in Auckland on any given day:
- Alert Level AKL March 2020
- Alert Level AKL August 2021
Secondary values
This enables you to visualize data with different scales on the same chart. I have used it to overlay the Alert Levels behind the COVID Cases Reported. The highest alert level is 4, while the highest number of NZ COVID Cases Reported on a single day is over 80. If these were both plotted on the same scale we wouldn't be able to see the change in alert levels very easily. In my example, I have put the COVID Cases Reported in the secondary values:
- Lockdown March 2020 Cases
- Lockdown August 2021 Cases
Small multiples
This lets you create multiple charts without the need to copy paste. It ensures the scale and axes are consistent across all the visuals, ensuring that your report reader can safely compare and pick up on patterns across the visualizations. It's a relatively new feature that has been added to all the core Power BI visuals and I have blogged before about Small Multiples.
Tooltips
Tooltips are also available on most Power BI visuals - I will be doing a separate blog on Tooltips where I compare the built in tooltips to Report Page Tooltips.
Formatting Options
Once you've got the data into the visual, it's time to format it nicely. Select the visual, then click on the format paint roller to view the formatting options.
General
For most visuals this has the responsiveness, size, position, layer order and alt text. The Area Chart General formatting (and line chart too) have an extra option in here for High Density Sampling.
> High Density Sampling
High Density Sampling is a feature that ensures Power BI visuals capture all the outliers in your data and provide a true representative sample even when working with many data points. By default this is set to 'On' and you should leave it that way.
In the visual below, you can see that with high density sampling turned on, there's a break in the pink negative areas. With high density sampling turned off, that break is missed because the visual is only plotting regular samples at specific time periods, and misses the maximum value in that range. The high density sampling algorithm ensures that the min and max values are always plotted, and therefore we see the more accurate representation of the data which indicates a break in the negative pink area:
Legend
The 'Legend' section will only appear under formatting options if you have either:
- A field in the 'Legend' category, OR
- Multiple fields in the 'Values' category, OR
- Multiple fields in the 'Secondary values' category, OR
- A field or fields in both the 'Values' and 'Secondary values' categories
I particularly like to play around with the 'Style' section of the Legend. Depending on what options you select further down (in Shapes section) you may want to change the default Style.
X axis
By default, this will be set to 'Continuous' which will ensure you can see the entire time range on one screen, but may also result in some sampling, so make sure you've selected the right 'High Density Sampling' option from the General section when Continuous is set to on.
This dataset has been curated so I decided how many days I wanted to visualize, therefore the 'End' of x axis set to auto will plot all 100 days I created in my GENERATESERIES column for the x axis. You may wish to use the Conditional formatting option here to find the last point in time with data and ensure the x axis stops there. Wonderful power and flexibility! You can even apply conditional formatting to the axis labels (for example on a categorical axis you could change the color for weekends vs weekdays - how cool is that?)!
Y axis
The Y axis settings are mostly a mirror of the X axis. If you're using multiple fields in the 'Values' you may want to turn on and change the Title of the Y axis so that people know which numbers relate to which areas in the chart.
Secondary Y Axis
These settings only appear if you're using the 'Secondary Values' and are the same as the Y axis settings.
Zoom sliders
This is a relatively new feature that I'll leave for another post on another day, but basically it lets the user change the axes start and end values dynamically to focus on what they want to see.
Data colors
Unfortunately, there is no conditional formatting for data colors in the Area Chart, which is one of the things keeping it from getting a higher score in versatility. It's possible to set the data colors specific to each category or series if you're using multiple values or legend.
Data labels
Data labels can be customized by series - just scroll to the bottom and turn customize series to 'on' (will only work if Legend is a formatting option).
An important thing to note - the data labels don't enable you to show the series label for multiple values fields, but you can change the color so that it's easier to tell which numbers relate to which series. Which of the above images do you prefer? I don't like using color as the only distinguishing feature, so this is another reason this visual doesn't get higher scores for data clarity.
Shapes
This might be where the fun factor comes in, but it's also a really useful way to differentiate between your series.
I'm using the area chart to compare two distinct time periods - and to forecast based on previous values. Therefore I want the shapes for the previous 'forecast' to be dashed, making the actual current values stand out more. You can also adjust the stroke width and turn on markers to distinguish data points from the line connection. If you have stepped data (such as my Alert Levels) that you don't want a diagonal line for, turn the stepped layout to 'On'.
Plot area
This just contains the standard plot area format options - adjust the transparency or add a background image.
Note: this is different to the Background image and transparency - plot area does not include the legend and title of the visual.
Title
Includes all the beautiful title formatting options, including conditional formatting and word wrap if you have long titles or tiny screens.
Background
This is where you set the transparency and image for the entire visual - useful if you have something behind this visual that you want to hide or show (which sometimes happens when I'm creating mobile only visuals since Power BI has no option to hide a visual in desktop but show in mobile).
Otherwise I leave these as defaults.
Lock aspect
Turn this on if you want the visual to behave like images in Word or PowerPoint.
When Lock aspect is set to Off (the default), you can grab the corner of your visual and drag it anywhere - changing the aspect ration of the visual as you do.
When Lock aspect is set to On, you can grab the corner of your visual and it will only let you drag it along the diagonal of the existing visual - thereby maintaining the current aspect ratio.
If you resize using the side, top, bottom or General section of the visual Lock aspect has no impact.
Border
If you turn this on, you can add rounded corners by adjusting the 'radius'.
Shadow
Make sure you leave space between your visuals if using the Shadow effect.
Tooltip
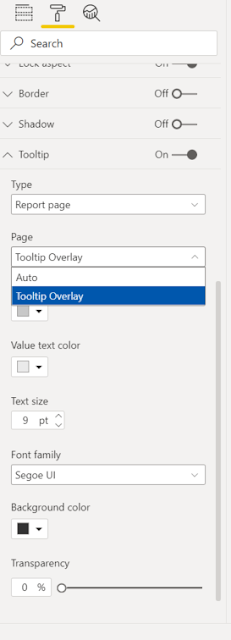
This is how you can change what the additional information that shows up on hover looks like - I'll detail these settings in a separate post because they are very cool and deserve their own post.
Visual header
A while back the visual header was updated to a new look and feel, and now you can control which features show up at the top of the visual when users hover or select the visual.
Note: This only impacts the header behavior in PowerBI.com so you need to publish the report to see the impact of the visual header changes.


