Today's post is about Power BI Dashboards - what they are, why we need them and how I used it to automate my Twitter posts (more on that in my next blog post).
Power BI Dashboards
Dashboard is a term that is widely used, but in the world of Power BI it has a specific function. A Power BI Dashboard:
- displays key metrics that you need to know RIGHT NOW
- can combine data from multiple reports and datasets, in one place
- enables you to set alerts on key measures
I really like this visual, borrowed from the Microsoft Docs on Dashboards to explain how dashboards differ from reports:
Manage Alerts
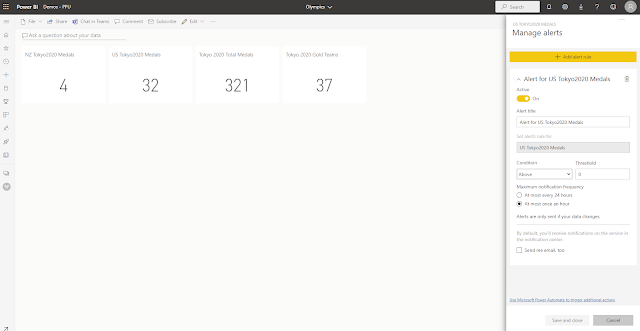
It's not possible to embed a dashboard on a public website, so I haven't created my dashboard for aesthetics. Instead, I have focused on the alert functionality and used my dashboard to trigger a Power Automate flow.
I have chosen to put only card visuals into my dashboard. Card visuals provide a single value that Power BI can monitor. This means we're able to set alerts on any of these card tiles in the dashboard.
How to set up alerts
To set up alerts on a dashboard:
- Pin a card or KPI visual to dashboard (or create one using question and answer). You can pin tiles from your report by hovering over the visualization and clicking the 'pin' icon.
- From the dashboard, click the three dots at the top of your card visual and select 'Manage alerts'. NOTE: for alerts to work, this visual must display a single value that Power BI can monitor. You will NOT see the 'Manage alerts' option for a column chart for example.
- Set the alert threshold. Note that Power BI will send you an alert ANY time the data changes if it's over/under the threshold you selected. For my scenario, I want to know any time the US wins a medal, so I have set my threshold to 0. Any time the data changes, I'll get an alert that the US has earned another medal. If the number doesn't change, the alert won't trigger (even if the value is greater than 0). Pretty powerful!
WARNING: If you republish the dataset this will trigger the alert, even if the value hasn't changed, so if you're using it for a similar purpose to me, you may want to update your alerts threshold to the current number, then republish the dataset.
Update Dashboard Tiles
Dashboard tiles will update automatically when the dataset is refreshed - they don't need the report anymore to update. That means that if you change something in the report, the dashboard won't change.
How I broke my dashboard
However, if you rename, remove or drastically alter the measure that is used in the dashboard tile, Power BI won't have any way to calculate that tile anymore. In the image below you can see the first two tiles on my dashboard display the PowerBI icon and no data value.
This is because they are referencing the [New Zealand Total Tokyo2020] and [United States Total Tokyo2020] measures. After pinning these dashboard tiles, I went back to my report and decided to rename the measures to [NZ Tokyo2020 Medals] and [US Tokyo2020 Medals] in an effort to shorten them a bit. Unfortunately, this change was not picked up by the dashboard. All the dashboard could see was that the original measures no longer existed.Therefore the dashboard tiles could not display a value. There is NO alert or warning that this has happened.
Always check your dashboard after a dataset change/republish
In order to fix this, I simply removed the old broken tiles and repinned the new tiles. It's an easy fix, but a little bit of a gotcha if you aren't aware.
As a rule of thumb, if you make any change to the report or data model (aka you do a re-publish overwriting an existing dataset), CHECK YOUR DASHBOARD and make sure all the tiles still have references and are pulling through the correct data.


