Today's post is inspired by @PlentyL in the Power BI Community. I find myself repeating many formatting options across Power BI reports, so thought I'd compile some of my 'defaults' here.
Time series Column Charts
Configure the chart as follows:

You'll need to use the Drill down arrows to view the month values, and this is the default we get:

Not exactly easy to read or pretty. So, let's clean it up a bit.
Sort X-Axis
First, we need to sort the X-Axis by Year-Month in ASCENDING order:

That looks a lot better already, but we still have some work to do.
Sort Month Name
If you haven't already sorted your date table, sort the Month column by Month number using the Sort by Column feature:

Already this is acceptable, but we'll go one step further.
Concatenate Labels OFF
The final step is to ensure the Year isn't repeated and takes up less space. To do this, we'll turn off the Concatenate Labels for the X-axis:
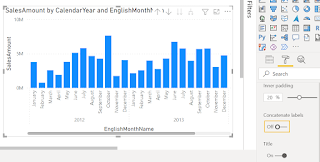
To do this, select the visual, click the Format paint roller icon, expand the X-axis formatting and scroll down slowly until you find 'Concatenate labels' and turn that off.
Voila! We now have a nicely formatted time series chart.
Filter by Date
If you want to take it one step further, you can add the Date column to the filters pane and filter by relative date:
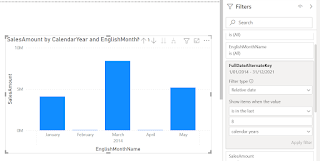
Drag the Date column from the DimDate table to the 'Filters on this visual' and set to Relative date. Note that if you choose Calendar Years or Calendar Months it will use the last date of the previous month as your max date. In the above screenshot you'll see this is Jan 31, 2022.
If you choose Years or Months, it will use today as the max date. In the below screenshot you'll see this is Feb 11, 2022:

Slicer Selection Controls
I've mentioned this in previous posts, but I'll say it again. Slicer visual formatting is one of my pet peeves in Power BI. It does exactly the opposite of what we are accustomed to in Excel.
Here is the default formatting of a slicer:


Let's add the search:

And now we'll edit the Selection controls:

Now I can easily select multiple items, all items, or deselect all items, as well as conduct a search for a particular item:


