Power BI has two main languages that we use to build reports - DAX and M. While it is possible to author a perfectly functional report without knowing anything about either of these languages, at some stage you are likely to find yourself face to face with some DAX measures or searching the web for a custom code in M. But what is the difference between these two foreign languages and why do you need both of them? Can't we just learn one really well and do everything in DAX or everything in M?
Not quite.
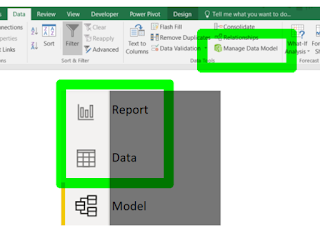
The Power BI Desktop makes the distinction between DAX and M clear by opening the Power Query Editor in a new window. M is the language of Power Query. DAX is the language of Power BI Data Model, or in other words is used in the normal Power BI report and data views.
For those of you using Excel, M is used in Power Query. DAX is used in Power Pivot Data Model.
Although it is possible to perform similar tasks using either M or DAX, there are some best practice considerations to help you decide when to use each. There is also a precedence.
- M is for building the data model - use this for transformations to your data, new columns, tables, merge and append of data, setting data types.
- DAX is for analyzing the data model - use this for explicit measures, dynamic calculations, aggregating and summarizing the data.
M - Power Query Transformations
- to edit an existing query, select Show Queries button in the Data tab in the ribbon, then right click on a Query and choose Edit
- to create a new query, select New Query button in the Data tab in the ribbon.
Once Power Query Editor opens, the ribbon, options and functionality are almost identical whether you're working in Power BI or Excel.
In order to use M code in Power Query, you can usually just click the buttons in the ribbon, and Microsoft Power Query will write the code for you. Use the Applied Steps to delete or edit steps that you have made.
If you want to do something a bit more advanced than what is available in the buttons, or if you want to make a quick edit that can't be done using Applied Steps, you may find writing custom M code to be your best solution.
To view the M code for each step as you apply them, turn on the formula bar. To turn the formula bar on, tick the Formula bar box in the View tab in the ribbon.
To view the M code that has been generated by all the buttons you've been clicking, click the Advanced Editor button in the ribbon.
This will open a window of the entire code that Power Query needs to Get, Transform and Load your data. You can carefully make changes directly to this code, or you can even copy and paste the code from one query to another.
Here is a sample Power Query code:
let
Source = Table.FromRows(Json.Document(Binary.Decompress(Binary.FromText("i45WUjBU0lEKcDJUAFJGJrpepXm6RgZGBiCupalSrA5QhRGQ7RoBUWGAosLcAKICYoYRSMgYVYUFkAQrMYYYgmoGTEEsAA==", BinaryEncoding.Base64), Compression.Deflate)), let _t = ((type nullable text) meta [Serialized.Text = true]) in type table [#" EmpID" = _t, #"CourseID " = _t, #"Date " = _t, #"Result " = _t]),
#"Changed Type" = Table.TransformColumnTypes(Source,{{" EmpID", Int64.Type}, {"CourseID ", type text}, {"Date ", type date}, {"Result ", Int64.Type}})
in
#"Changed Type"
Once you're happy with the data and have all the columns, transformations and cleansing of the data, you can load it into the data model.
In Power BI, just click Close & Apply.
In Excel, click Close & Load to. Make sure you tick the box to Add this data to the Data Model.


