It's the start of a new year, so that logical time to look back at what you've accomplished in the past year and look ahead for your future goals. I've been absent from blogging for much of the year, so hoping to do better at that this year. Even so, my blog on date tables and why you need them for Power BI or Excel Data Model projects is still my most viewed blog for the year. You can find it here:
Excel with Allison: DimDate: What, Why and How?
I myself still refer back to that blog post whenever I start a new project where there isn't a date table already in the data source. Below are a few of my other favorite resources that I visited most frequently in 2022.
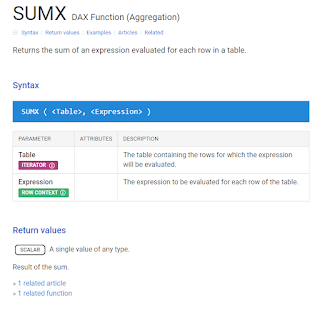
DAX Guide
I still refer to this DAX.guide at least once a week, even though I'm pretty good at writing DAX. 😉
It's really useful when:
- using a new function for the first time
- doing a measure or code you haven't used in a while
- optimizing code
- looking for something new to learn
Pay close attention to the return value of each function - this is important to making sure you get the results you expect.
Keyboard Shortcuts
There are some great keyboard shortcuts in Power BI. I particularly love the 'DAX Editor' ones in this reference below. My strategy is to pick one or two new shortcuts and practice them (daily if possible) until they become second nature. Then I go back to the list and find two new ones. This week I'm going to start working on:
Ctrl Shift \
which jumps to the matching bracket.
Best Practice Power Query
Okay, this isn't one of my most visited sites, I just stumbled upon it recently. But it is pretty useful and one that I wanted to bookmark and highlight as I know it'll come in handy for future projects. This is a fantastic article that anyone using Power Query should at least skim. Thanks Microsoft for making some quality content with design considerations!
Best practices when working with Power Query - Power Query | Microsoft Learn
Timesaving Tips
Align Page to Center
I have been doing this the long way for years, but just recently discovered a tick box in the global settings to align the pages for all future reports to center. This makes it so much easier to see your visuals while editing DAX formulas!
How To
You can find this option under File > Options & Settings > Global > Report Settings

Align Visuals
This can be one of the most tedious tasks in Power BI - aligning and formatting your visuals so that they don't detract from the main message. There's lots of ways to format visuals, and I use a combination of methods to get my reports to look just right.
Step 1: Resize
I use the Format pane > General > Properties to resize my visuals so I know they're exactly the size I want. Tip: If you're resizing multiple visuals that are all the same type and you want them to be the same size, use the Ctrl key to select them all and you can resize all at once!

Step 2: Align
You can continue using the Format pane for position of visuals. I sometimes do this for the first visual on the page, but then I use the Align option to line them all up perfectly. I love the 'Distribute horizontally' option. I think I use it most often.

Step 3: Format painter
This is an oldie but a goodie. You may know the Format painter tool from other Microsoft applications such as Excel or Word. Well, it's in Power BI too. The great thing about the Format painter is that you can copy formatting from a bar chart to a column chart using this tool. It's so smart, that if you format the y-axis of a column chart, and format paint that onto a bar chart it will apply to the x-axis of the bar chart. Confused? Just try it out!


