
Have you ever come across (Blank) values in your charts or visualizations even though you are certain there are absolutely no blanks in your data itself? In this post we will explore why Blank values can creep into those visuals and what it means.
Most Common Causes for (BLANK) Values
The main causes for (BLANK) showing up on a chart or table visualization are:
- Source Data is Blank: There are blank, null or empty values (or cells) in your source data.
- Source Data is Missing Values: There is no record (or row) in the source data that relates to the specific information displayed in the visualization.
Source Data is Blank
The first cause for BLANK values to show up within a visualization is simply that there are Blank values in the source data. This can happen when working with just one table, or multiple tables.
For example, examine the Sales table below:
Loyalty Card Number | Product | Qty Liters | Date Key |
1001 | Diesel | 42 | 20200701 |
| Gas | 51 | 20200701 |
1002 | Gas | 60 | 20200702 |
1003 | Diesel | 62 | 20200703 |
1002 | Gas | 13 | 20200703 |
1006 | Gas | 41 | 20200704 |
Row 2 is missing a value for Loyalty Card Number. This indicates the customer did not have (or did not want to use) a customer loyalty card. Therefore, I will not be able to figure out how many sales that customer has made. Additionally, since I already have a blank value in the Sales table, this Blank will carry through to any other tables I relate or merge with the Sales table. So, I also won't know if this sale for 51 liters should be credited to male or female customers from the Customers table.
Source Data is Missing Values
The second cause for BLANK values appearing in our data stems from an unmatched value when combining two or more tables. This can happen with relationships in Power BI/Excel, or when doing a Merge.
Of course, we know that Blank values can appear in your visualization if there are empty, null or blank values in your raw data. Often though, that isn't the case. Let's take a simple, small data model for example:


So why do we have (Blank) showing up in our column chart?
Identifying Blank Values
We know that our two tables above are related by Loyalty Card Number column, so let's take a closer look at these values. I want to know what DISTINCT values we have for Loyalty Card Number in each table.
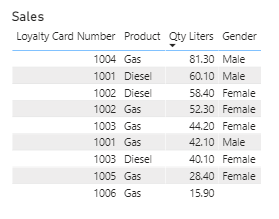
Note that our Sales table has one extra Loyalty Card Number that does not exist in the Customers table: 1006. In the tables below, we can identify that the 15.90 Liters purchased with Loyalty Card Number are the cause for the (Blank) values in my visualizations.

Even though we have a Gender for every Loyalty Card Number that is in the Customers table, not every Loyalty Card Number exists in the Customers table. So looking at the Sales table in the right of the image above, we can identify the Gender for all sales until we get to Loyalty Card Number 1006. 1006 does not exist in the Customers table, so we are stuck, and so are Power BI and Excel. There is no way to know the gender of the customer who used Loyalty Card Number 1006 based on the data we have.
It would be inaccurate to remove the sale for Loyalty Card Number 1006 - that sale actually happened. It would also be inaccurate to assign a value of Male, Female, 0, or anything else. So instead, that sale is reported and assigned a (Blank) value for Gender, and any other columns coming from the Customers table.
"Fixing" Blank Values
There is currently no way to easily replace the (Blank) label in Power BI or Excel with another label, such as "Unknown", without editing the raw data either in Power Query Editor or in the data source itself.
We can of course put a filter on the visualization to remove (Blank) values, but as mentioned earlier, this would skew the report and is not accurate. Those sales actually happened and we need to report on them.
Loyalty Card Number Example Explained
The problem lies in the data itself. Let's dig a bit deeper into this Loyalty Card Number example. Imagine you are a customer at a gas station. As you pay for your gas, the sales attendant asks if you'd like to join their loyalty program, it's free! "Sure," you say. After all, why not? So the sales attendant scans a new loyalty card, processes your order and you pay. The sales attendant hands you the loyalty card and explains that you need to register the card online in order to be eligible for savings and discounts.
So what does that sale look like right now? You have paid for your gas, so the sale appears in the Sales table. The sales attendant scanned the loyalty card, so that too appears in the Sales table. You have NOT registered your card online, so no information is known about you yet.
Power BI and Excel with both allow a relationship to be created between two tables, such as Sales and Customers, even though some values exist in the Fact (Sales) table that are not in the Dimension (Customers) table. Just because we are able to do something, does not mean that we should.
The sales attendant had a loyalty card to scan, so we must know that Loyalty Card Number 1006 exists. We just don't know yet who will own it. If we want to avoid having Blank values in our visualizations and instead show "Unknown", then we need to update our source data to include all possible Loyalty Card Numbers that could ever make a sale.
As in the image below, this means adding Loyalty Card Number 1006 to the Customers table and typing a value of "Unknown" for every column/field of information we don't yet have or know.

Once we update our Customers table, the Sales by Gender information updates automatically to display "Unknown" instead of (Blank). This can make it a little be more clear to the end user what information is actually being displayed in this report and eliminate the question "What the (Blank)??"


